See what changes
the comparison.
Explore a topic. Follow the calculation. Keep the context.
Open the workbenchA one-day shift can reverse a comparison
Recalculate two hypothetical price paths with a fixed window and a common base of 100. See why the start date matters.
Read the insight Explore the method and sources in the article
Reconcile GBP/AUD with two dollar quotes
Use illustrative GBP/USD 1.25 and AUD/USD 0.625 to calculate GBP/AUD 2.00. Write the units before choosing multiplication or division.
Read the insight Explore the method and sources in the article
Align quote units before comparing BTCUSD and BTCUSDT
Convert hypothetical USD and USDT quotes to one unit before subtracting them. Keep provider, timestamp and price type in the record.
Read the insight Explore the method and sources in the article
Keep actual, forecast and revised values in separate fields
Use a hypothetical index release to distinguish a forecast gap, a revision and a period-to-period change without overwriting the original observation.
Read the insight Explore the method and sources in the article
Separate displayed time from candle boundaries
A UTC timestamp can be shown in Korean time without changing the observation. Rebuilding daily aggregation boundaries is a separate operation.
Read the insight Explore the method and sources in the article
Why inverting a rate does not turn +10% into −10%
Invert a hypothetical 2.00→2.20 exchange rate and inspect the denominator used for each percentage change.
Read the insight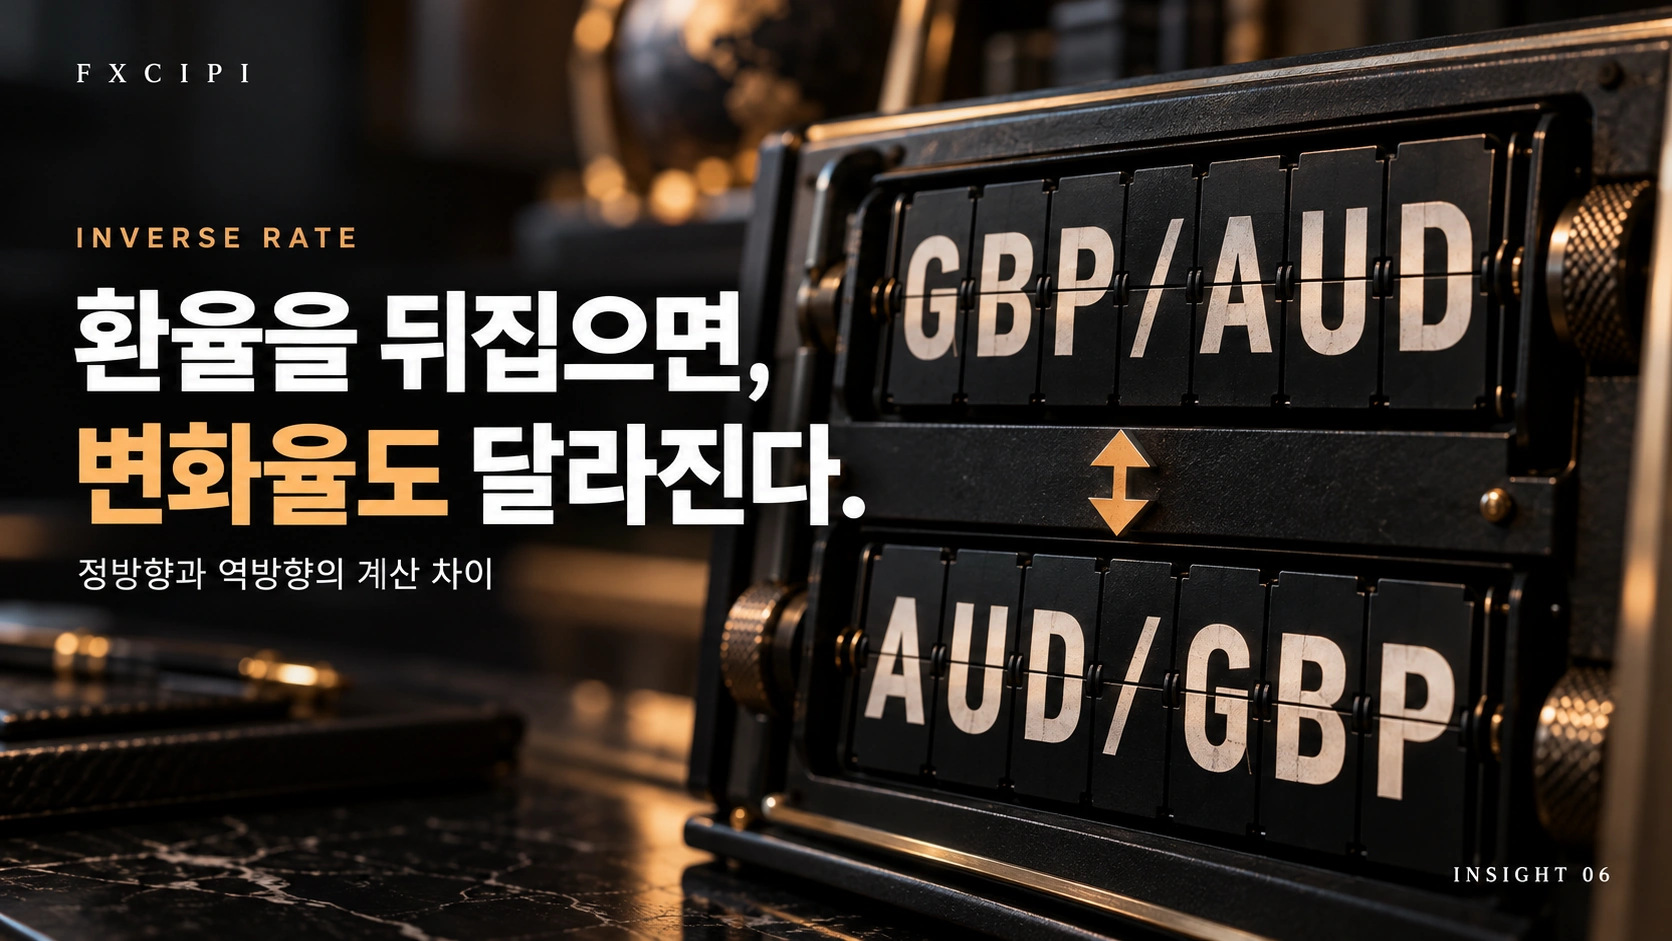 Explore the method and sources in the article
Do not add quantity, turnover and price-update counts
Use a unit-labelled ledger to distinguish BTC volume, USDT turnover, trade counts and FX price updates before comparing data.
Read the insight Explore the method and sources in the article
Write an observation that can be reproduced later
Record provider, timestamp, units and formulas alongside the chart. Separate what you saw, what you calculated and what you inferred.
Read the insight Explore the method and sources in the article
Select a topic to view its cover. Open the article for the complete method and sources.
Now use your own numbers.
Compare two price changes, check a cross rate and keep your observation in one place.
Put your learning into practice.
Change one setting at a time. Check the symbol, interval and indicators in the chart toolbar.
Load the chart to explore symbols, intervals and indicators.
Data may be delayed depending on the symbol and provider. This is a viewing and learning tool; it does not execute orders.